Top Watches for 9/24/26
Not a financial advisor. For education only — not financial advice.
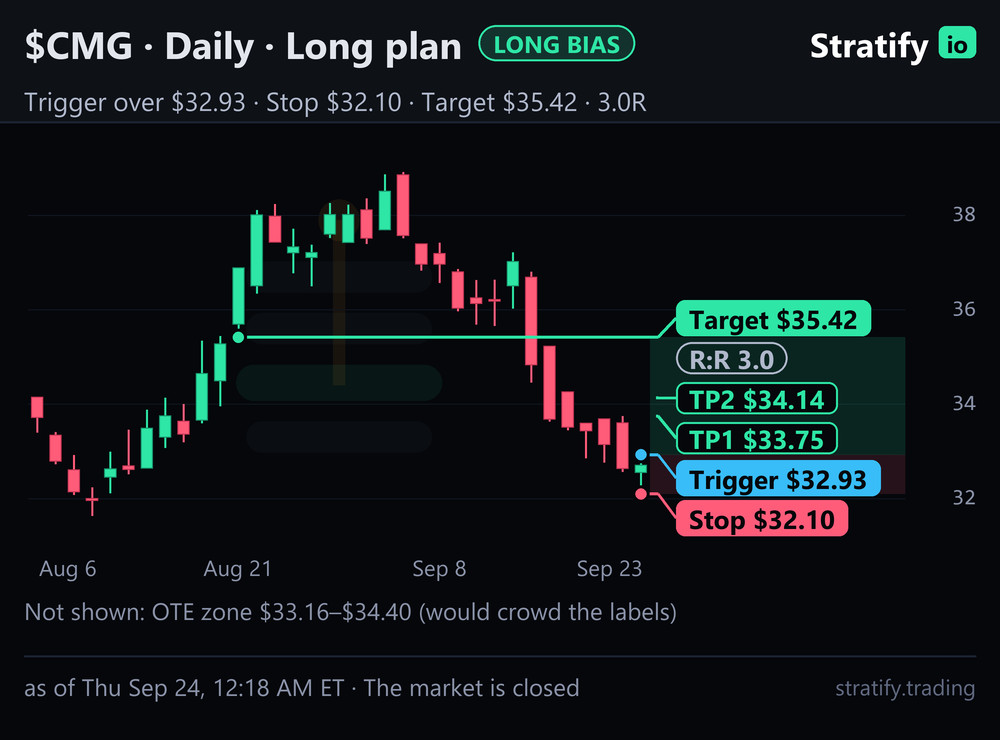
Target $35.42
Stop $32.10
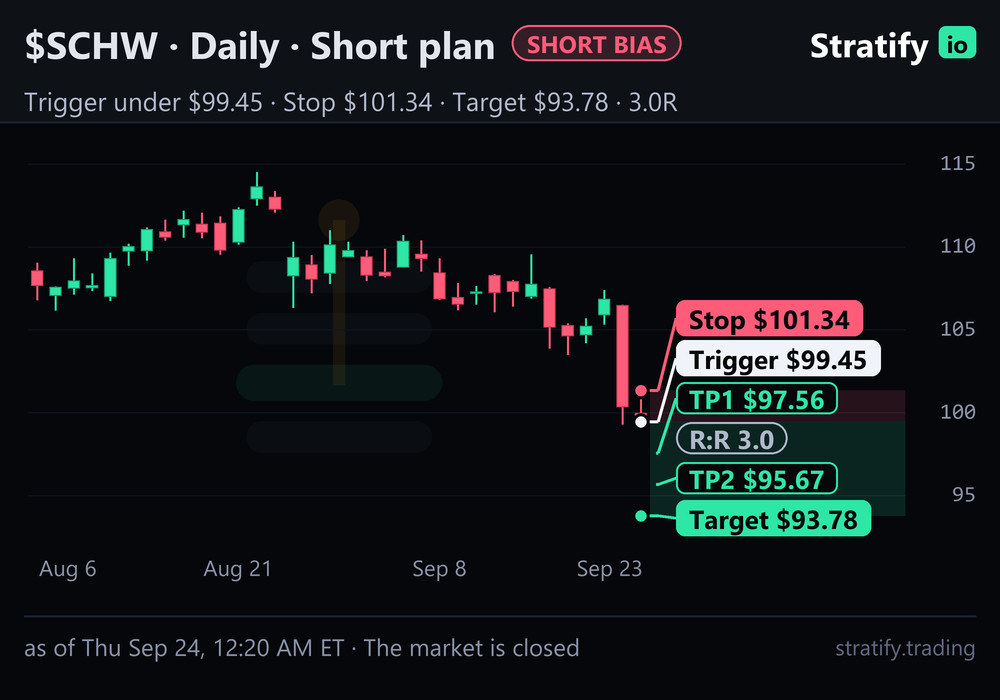
Target $93.78
Stop $101.34
$CMG — Long bias · Daily
high convictionData as of Thu Sep 24, 12:18 AM ET
Not a financial advisor. For education only — not financial advice.
$CMG (Chipotle) last traded at $32.75 in extended hours (regular-session close $32.72) (+0.36% vs the prior close). The market is closed, so these are the last session's prices (read Thu Sep 24, 12:18 AM ET).
LONG · conviction 89/100 (High). The site's scanner ranks this daily 3-BAR → FAILED 2 DOWN (3→F2D) setup #1 of 322 right now (it is on the top-10 list), and it reads long because the setup's own name reads long. The score ranks setup quality; it is not a forecast. Backing: 12 real signals for, 4 against (counted under Confluence and Watch-outs).
The setup
Setup: 3-BAR → FAILED 2 DOWN (3→F2D) on the daily chart. As Stratify's lesson "The Failed 2 — the trap" puts it: Price takes the level, then closes back through it. The chasers are underwater. The setup is a Failed 2 Down: price broke below the prior low, then closed back inside. The sellers who chased it are trapped, which is the bullish read.
Why this conviction
- Setup type: 3-BAR → FAILED 2 DOWN (3→F2D) carries +30 points on the site's tier list.
- Volume: relative volume 1.51x normal (live) adds +45 (capped at 45).
- The live volume gate is passing now: +6.
- Price action: the last print ($32.75) is 0.56% from the trigger ($32.93), +8.
That adds up to 89/100. These are display weights that rank setups against each other, not a win rate.
Confluence
Backing: 12 real signals for this long from 7 independent sources, 4 against (the ones against are listed under Watch-outs). Only evidence that lines up behind the plan is counted; the setup's own name, its score and its structure target are the plan itself, not backing for it.
- Chart: The daily trend is up (since Jun 30): higher highs and higher lows.
- Chart: The weekly trend is up.
- Volume: volume is 1.51x normal (RVOL), so more people are behind the move.
- GEX: on the Sep 25 expiry (read Sep 24, 12:18 AM ET), the magnet $33 sits between the trigger and the target, where hedging tends to pull price.
- GEX: on the Sep 25 expiry (read Sep 24, 12:18 AM ET), the put wall $32 sits just under the trigger as a floor.
- GEX: on the Sep 25 expiry (read Sep 24, 12:18 AM ET), price is above the gamma flip ($30.14), where hedging steadies moves.
- Flow: on the Sep 25 expiry, calls are 62% of that expiry's volume.
- Target: At the target: 922 calls traded today at strikes within 3% of it (30% of that expiry's call volume) - options money is positioned for price to reach about the target.
- Dark pool: the Sep 23 off-exchange average price $32.62 (8.8M shares) sits just behind the trigger, where it can act as support.
- Dark pool: the Sep 22 off-exchange average price $33.11 (4.0M shares) sits between the trigger and the target, where price tends to react.
- Target: the one-session options-implied move is about +/-2.4% (from the Sep 25 at-the-money straddle); scaled by the square root of time to the estimated 6-session hold that is about +/-5.8%, and the target is 7.6% away - within 1.3x of the priced-in move, so it is a realistic distance.
- Catalyst: a live catalyst - Chipotle (CMG) Is Piloting Palantir (PLTR) for Food Safety. Does It Matter for Investors? (Insider Monkey, Sep 23). The site reads it as bullish (open interest skewed to calls), and the tape agrees: price +0.4% today on 1.5x volume. Options price about +/-5.8% over the estimated 6-session hold (the Sep 25 straddle, scaled by the square root of time), and the target is 7.6% away, so the priced-in move reaches most of the way there.
Plan facts (not counted):
- The trigger $32.93 sits at the previous day high (PDH $32.93) - a level the market already respects. On a daily setup that is by construction, so it is not counted as backing.
- The stop $32.10 sits at the previous day low (PDL $32.10) - a level the market already respects. On a daily setup that is by construction, so it is not counted as backing.
- The target $35.42 is the 10 candle structure - a price the market has already traded, not a projection.
The plan
Wait for price to trade above $32.93. Stop at $32.10 ($0.83 of risk per share). Target $35.42 (+7.6%, about 3.0 to 1). The stop is 2.5% from the trigger. Checkpoints on the way: $33.75 and $34.14.
Until the trigger prints, nothing is confirmed. The stop is where the idea is wrong; if price gets there, the plan is over. This is a daily setup.
Estimated hold: about 6 trading days after the trigger prints (typically 3 to 9 trading days). This plan's target is 2.2 ATRs from the trigger. That is measured, not a forecast: it is the middle of what 448 past daily 3-BAR → FAILED 2 DOWN (3→F2D) setups on the long side took whose target sat 1.9 to 2.5 ATRs away (this one is 2.2), so it moves with the target's distance at today's ATR. Price is 0.2 ATR from the trigger now; setups that began that close to theirs printed it within about 1 trading day. Once triggered, half of the ones that reached the target did so within 6 trading days, but only 36% of the triggered setups got there at all. If it has not paid by about 14 trading days after the trigger, treat the idea as stale.
Prior day and prior week levels
The extremes of the previous session and week are levels the market already respects. Only the ones this plan is built on are shown - on a daily setup the trigger and stop are the last session's low and high by construction.
- PDH $32.93 - the high of the last completed session; the trigger ($32.93) sits at it.
- PDL $32.10 - the low of the last completed session; the stop ($32.10) sits at it.
Options positioning (GEX)
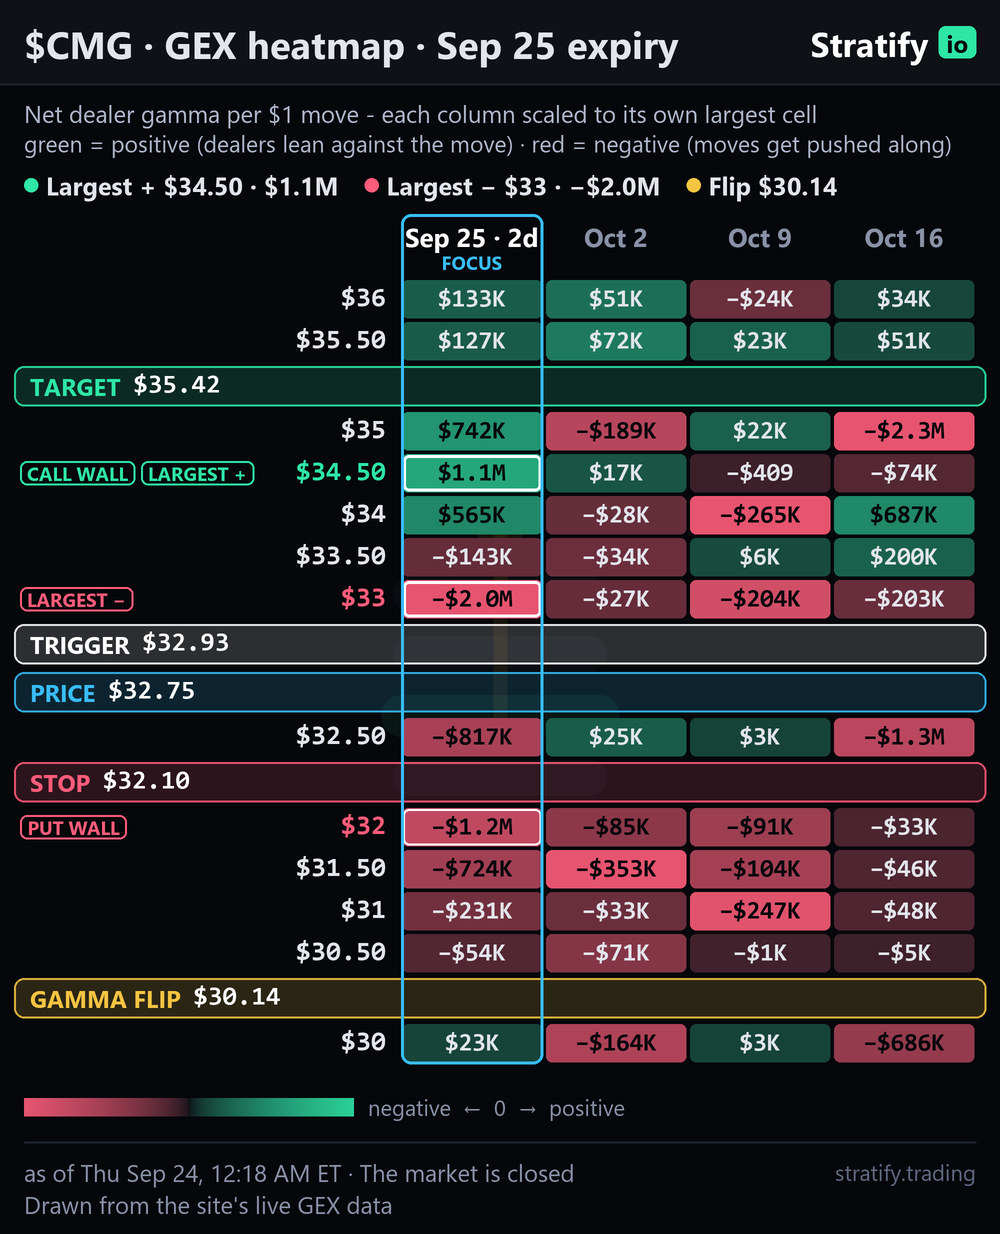
- Expiry used: Sep 25 (2 days out), read Sep 24, 12:18 AM ET; every level below is recomputed from that expiry's own 38 strikes - of the expiries read, its gamma map and options flow back the long idea most (score +6; also read: Oct 2 (+6)).
- Backs the plan: The magnet $33 sits between the trigger and the target, where hedging tends to pull price.
- Backs the plan: The put wall $32 sits just under the trigger as a floor.
- Backs the plan: Price is above the gamma flip ($30.14), where hedging steadies moves.
- Caution: The call wall $34.5 sits between the trigger and the target as a ceiling.
Dark pool levels
Dark pools are trades matched away from the public exchanges. Each level is the average price (volume-weighted) of one session's off-exchange volume; only the levels that sit where they help this trade are shown.
- Sep 23 - $32.62: 8.8M shares off-exchange (57% of that session's volume), -0.4% from price.
- Sep 22 - $33.11: 4.0M shares off-exchange (46% of that session's volume), +1.1% from price.
Options flow
Only big unusual prints count: a call bought at the ask (never sold at the bid), with at least $250K actually paid at the fills, volume at least 3x the open interest, expiring within 3 months and not deep in the money - searched across every expiry the flow engine holds for this ticker, not just one. Strikes between the trigger and the target come first, then the largest amount paid, then the nearer expiry; a second contract is shown only if at least a quarter of the first. A print whose fills cannot be read is not shown - its size would be a guess.
No single options print of $250K or more, bought at the ask, backs this idea right now. (1 candidate contract read.)
The expiry's own volume by strike still reads:
- Backs the plan: Calls are 62% of that expiry's volume.
- Backs the plan: At the target: 922 calls traded today at strikes within 3% of it (30% of that expiry's call volume) - options money is positioned for price to reach about the target.
Repeated sweeps - a call the site's tape marked as swept at least 3 times at the ask in the last session (a sweep is one order filled across several exchanges at once, as the tape tags it). Counted as flow only when the combined amount paid clears the same $250K bar.
No contract was swept repeatedly at the ask in the last session.
For context, calls are 62% of the last session's options volume in the Sep 25 expiry (put/call ratio 0.62).
Watch-outs
- The monthly trend is down. That argues against the bias.
- Price ($32.75) is below last week's low (PWL $32.86): it has broken down out of last week's range. That argues against the bias.
- Price ($32.75) is below this month's open ($38.13, 14.1% lower). That argues against the bias.
- The call wall ($34.50) sits between the trigger and the target, so expect price to slow or react there.
- On this chart, from a spot like this, the trend continued 46% of the time (57 cases) - close to a coin flip, so respect the stop.
- Structure: a close below $31.64 would flip the daily trend the other way (a change of character).
- The idea is wrong if price trades below $32.10.
Beginner notes
- Long / short: Long means buying, to profit if price rises. Short means selling first, to profit if price falls.
- Conviction score: The site's 0 to 100 ranking of how good a setup looks right now: the kind of setup, how much volume is behind it, whether the daily and weekly agree, and how close price is to the trigger. 70 and up is high, 45 to 69 medium, under 45 low. It ranks setups against each other; it is not a forecast or a win rate.
- RVOL (relative volume): A day's volume compared with the stock's normal. 1.0x is normal, 2.0x is double.
- Options-implied move: How far the options market prices the stock to move in one session, worked out from the nearest expiry's at-the-money straddle. To compare it with a target reached over several sessions it is scaled by the square root of time (four sessions = twice the one-session move). It is a typical range, not a limit - but a target far beyond it needs more than the usual move.
- Trigger: The price that has to trade before the idea is live. Until it prints, nothing is confirmed.
- Stop: The price where the idea is wrong. You leave there so a bad guess stays small.
- Target: Where the plan takes profit.
- R:R (reward-to-risk): How much the plan aims to make for every $1 it risks. 2 to 1 means $2 of target for $1 of stop.
- Hold time: How long a trade stays open: from the moment the trigger prints until the target or the stop is reached. The estimate is the middle of what similar past setups took - half were quicker, half slower - so it is a typical, not a promise.
- ATR (average true range): The typical size of one candle on this timeframe. A target 3 ATRs away needs roughly three candles' worth of movement, which is why distance decides how long a hold takes.
- PDH / PDL / PWH / PWL: The previous day's high and low, and the previous week's high and low. Traders watch them because price often stalls, turns or breaks out at these prior extremes.
- GEX (gamma exposure): How much options dealers must buy or sell as price moves. Where it is large, price tends to stall or slow down.
- Call wall: The strike with the most call positioning above price. It often acts like a ceiling.
- Gamma flip: The price where dealer hedging changes character. Above it, hedging tends to calm price; below it, it can speed moves up.
- Largest net positive GEX: The strike with the most positive gamma. Dealer hedging there leans against moves, so price tends to stick or get pulled toward it.
- Dark pool level: A price where a lot of shares traded away from the public exchanges. Each level here is that session's volume-weighted average off-exchange price. Big off-exchange prints often act as support or resistance.
- Put/call ratio: Puts traded divided by calls traded. Under 1.0 means more calls than puts.
- BOS / CHoCH: A break of structure (BOS) is a close through the last swing in the trend's direction, so the trend continues. A change of character (CHoCH) is a close through the protective level against it, so the trend flips.
$SCHW — Short bias · Daily
high convictionData as of Thu Sep 24, 12:20 AM ET
Not a financial advisor. For education only — not financial advice.
$SCHW (Charles Schwab) last traded at $99.51 in extended hours (regular-session close $99.52) (-0.83% vs the prior close). The market is closed, so these are the last session's prices (read Thu Sep 24, 12:20 AM ET).
SHORT · conviction 76/100 (High). The site's scanner ranks this daily 2-1 FORMING (2-1-?) setup #10 of 322 right now (it is on the top-10 list), and it reads short because the setup names no direction, so it leans to the nearer trigger: price is closer to the short trigger (99.45) than the long one (101.34). The daily trend runs the other way, so this is a counter-trend idea. Keep the position small. The score ranks setup quality; it is not a forecast. Backing: 10 real signals for, 4 against (counted under Confluence and Watch-outs).
The setup
Setup: 2-1 FORMING (2-1-?) on the daily chart. As Stratify's lesson "The 2-1-2, both ways" puts it: A push, a coil, then a break — with or against what came before.
Why this conviction
- Setup type: 2-1 FORMING (2-1-?) carries +22 points on the site's tier list.
- Volume: relative volume 1.25x normal (live) adds +38 (capped at 45).
- The live volume gate is passing now: +6.
- Price action: the last print ($99.51) is 0.06% from the trigger ($99.45), +11.
That adds up to 76/100. These are display weights that rank setups against each other, not a win rate.
Confluence
Backing: 10 real signals for this short from 6 independent sources, 4 against (the ones against are listed under Watch-outs). Only evidence that lines up behind the plan is counted; the setup's own name, its score and its structure target are the plan itself, not backing for it.
- Chart: History on this chart: from a spot like this the trend reversed 64% of the time (59 cases).
- Chart: Price ($99.51) is below last week's low (PWL $103.50): it has broken down out of last week's range.
- Chart: Price ($99.51) is below this month's open ($109.44, 9.1% lower).
- Volume: volume is 1.25x normal (RVOL), so more people are behind the move.
- Target: At the target: the put wall $95 sits right at it (+1.3% away), where dealer hedging concentrates - price tends to be drawn there or stall there, so it is a natural place to take profit (on the Oct 2 expiry (read Sep 24, 12:20 AM ET)).
- GEX: on the Oct 2 expiry (read Sep 24, 12:20 AM ET), price is below the gamma flip ($104.66), where hedging can speed a fall.
- Flow: on the Oct 2 expiry, puts are 80% of that expiry's volume.
- Target: At the target: 1,145 puts traded today at strikes within 3% of it (18% of that expiry's put volume) - options money is positioned for price to reach about the target.
- Dark pool: the Sep 23 off-exchange average price $100.22 (4.0M shares) sits just behind the trigger, where it can act as resistance.
- Target: the one-session options-implied move is about +/-1.9% (from the Sep 25 at-the-money straddle); scaled by the square root of time to the estimated 5-session hold that is about +/-4.2%, and the target is 5.7% away - within 1.4x of the priced-in move, so it is a realistic distance.
Plan facts (not counted):
- The stop $101.34 sits at the previous day high (PDH $101.34) - a level the market already respects. On a daily setup that is by construction, so it is not counted as backing.
- The trigger $99.45 sits at the previous day low (PDL $99.45) - a level the market already respects. On a daily setup that is by construction, so it is not counted as backing.
- The target $93.78 is the 60 candle structure - a price the market has already traded, not a projection.
The plan
Wait for price to trade below $99.45. Stop at $101.34 ($1.89 of risk per share). Target $93.78 (-5.7%, about 3.0 to 1). The stop is 1.9% from the trigger. Checkpoints on the way: $97.56 and $95.67.
Until the trigger prints, nothing is confirmed. The stop is where the idea is wrong; if price gets there, the plan is over. This is a daily setup.
Estimated hold: about 5 trading days after the trigger prints (typically 3 to 8 trading days). This plan's target is 2.3 ATRs from the trigger. That is measured, not a forecast: it is the middle of what 3,240 past daily 2-1 FORMING (2-1-?) setups on the short side took whose target sat 1.9 to 2.6 ATRs away (this one is 2.3), so it moves with the target's distance at today's ATR. Price is within a tenth of an ATR of the trigger, but it has not printed yet. Once triggered, half of the ones that reached the target did so within 5 trading days, but only 23% of the triggered setups got there at all. If it has not paid by about 13 trading days after the trigger, treat the idea as stale.
Prior day and prior week levels
The extremes of the previous session and week are levels the market already respects. Only the ones this plan is built on are shown - on a daily setup the trigger and stop are the last session's low and high by construction.
- PDH $101.34 - the high of the last completed session; the stop ($101.34) sits at it.
- PDL $99.45 - the low of the last completed session; the trigger ($99.45) sits at it.
Options positioning (GEX)
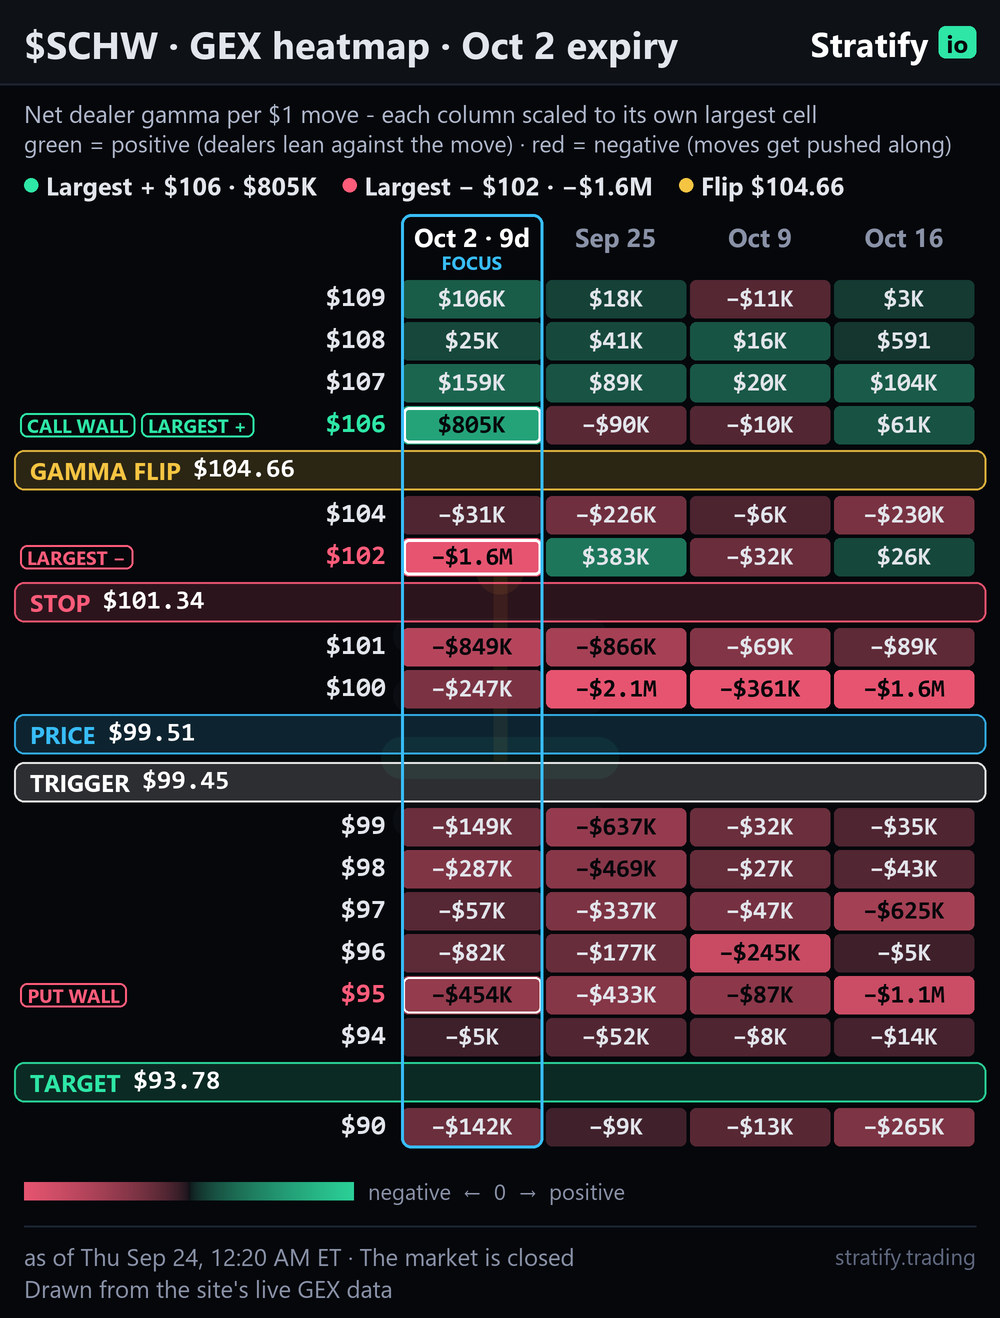
- Expiry used: Oct 2 (9 days out), read Sep 24, 12:20 AM ET; every level below is recomputed from that expiry's own 37 strikes - of the expiries read, its gamma map and options flow back the short idea most (score +7; also read: Sep 25 (+4)).
- Backs the plan: At the target: the put wall $95 sits right at it (+1.3% away), where dealer hedging concentrates - price tends to be drawn there or stall there, so it is a natural place to take profit.
- Backs the plan: Price is below the gamma flip ($104.66), where hedging can speed a fall.
- Caution: The put wall $95 sits between the trigger and the target as a floor.
Dark pool levels
Dark pools are trades matched away from the public exchanges. Each level is the average price (volume-weighted) of one session's off-exchange volume; only the levels that sit where they help this trade are shown.
- Sep 23 - $100.22: 4.0M shares off-exchange (50% of that session's volume), +0.7% from price.
Options flow
Only big unusual prints count: a put bought at the ask (never sold at the bid), with at least $250K actually paid at the fills, volume at least 3x the open interest, expiring within 3 months and not deep in the money - searched across every expiry the flow engine holds for this ticker, not just one. Strikes between the trigger and the target come first, then the largest amount paid, then the nearer expiry; a second contract is shown only if at least a quarter of the first. A print whose fills cannot be read is not shown - its size would be a guess.
No single options print of $250K or more, bought at the ask, backs this idea right now.
The expiry's own volume by strike still reads:
- Backs the plan: Puts are 80% of that expiry's volume.
- Backs the plan: At the target: 1,145 puts traded today at strikes within 3% of it (18% of that expiry's put volume) - options money is positioned for price to reach about the target.
Repeated sweeps - a put the site's tape marked as swept at least 3 times at the ask in the last session (a sweep is one order filled across several exchanges at once, as the tape tags it). Counted as flow only when the combined amount paid clears the same $250K bar.
No contract was swept repeatedly at the ask in the last session.
For context, puts are 80% of the last session's options volume in the Oct 2 expiry (put/call ratio 3.98).
Watch-outs
- The daily trend is up (since Jul 1): higher highs and higher lows. That argues against the bias.
- The weekly trend is up. That argues against the bias.
- The monthly trend is up. That argues against the bias.
- This is a counter-trend idea: the daily trend is up, so it needs a clean trigger and a tight stop.
- The put wall ($95.00) sits between the trigger and the target, so expect price to slow or react there.
- Structure: the level that would confirm the turn is $87.63.
- The idea is wrong if price trades above $101.34.
Beginner notes
- Long / short: Long means buying, to profit if price rises. Short means selling first, to profit if price falls.
- Conviction score: The site's 0 to 100 ranking of how good a setup looks right now: the kind of setup, how much volume is behind it, whether the daily and weekly agree, and how close price is to the trigger. 70 and up is high, 45 to 69 medium, under 45 low. It ranks setups against each other; it is not a forecast or a win rate.
- RVOL (relative volume): A day's volume compared with the stock's normal. 1.0x is normal, 2.0x is double.
- Options-implied move: How far the options market prices the stock to move in one session, worked out from the nearest expiry's at-the-money straddle. To compare it with a target reached over several sessions it is scaled by the square root of time (four sessions = twice the one-session move). It is a typical range, not a limit - but a target far beyond it needs more than the usual move.
- Trigger: The price that has to trade before the idea is live. Until it prints, nothing is confirmed.
- Stop: The price where the idea is wrong. You leave there so a bad guess stays small.
- Target: Where the plan takes profit.
- R:R (reward-to-risk): How much the plan aims to make for every $1 it risks. 2 to 1 means $2 of target for $1 of stop.
- Hold time: How long a trade stays open: from the moment the trigger prints until the target or the stop is reached. The estimate is the middle of what similar past setups took - half were quicker, half slower - so it is a typical, not a promise.
- ATR (average true range): The typical size of one candle on this timeframe. A target 3 ATRs away needs roughly three candles' worth of movement, which is why distance decides how long a hold takes.
- PDH / PDL / PWH / PWL: The previous day's high and low, and the previous week's high and low. Traders watch them because price often stalls, turns or breaks out at these prior extremes.
- GEX (gamma exposure): How much options dealers must buy or sell as price moves. Where it is large, price tends to stall or slow down.
- Put wall: The strike with the most put positioning below price. It often acts like a floor.
- Gamma flip: The price where dealer hedging changes character. Above it, hedging tends to calm price; below it, it can speed moves up.
- Dark pool level: A price where a lot of shares traded away from the public exchanges. Each level here is that session's volume-weighted average off-exchange price. Big off-exchange prints often act as support or resistance.
- Put/call ratio: Puts traded divided by calls traded. Under 1.0 means more calls than puts.
- BOS / CHoCH: A break of structure (BOS) is a close through the last swing in the trend's direction, so the trend continues. A change of character (CHoCH) is a close through the protective level against it, so the trend flips.
Want this before it triggers?
Top Watch is the short list. Stratify is the full scanner behind it — live setups, alerts and the charts, on your phone.
Get Access See what’s inside